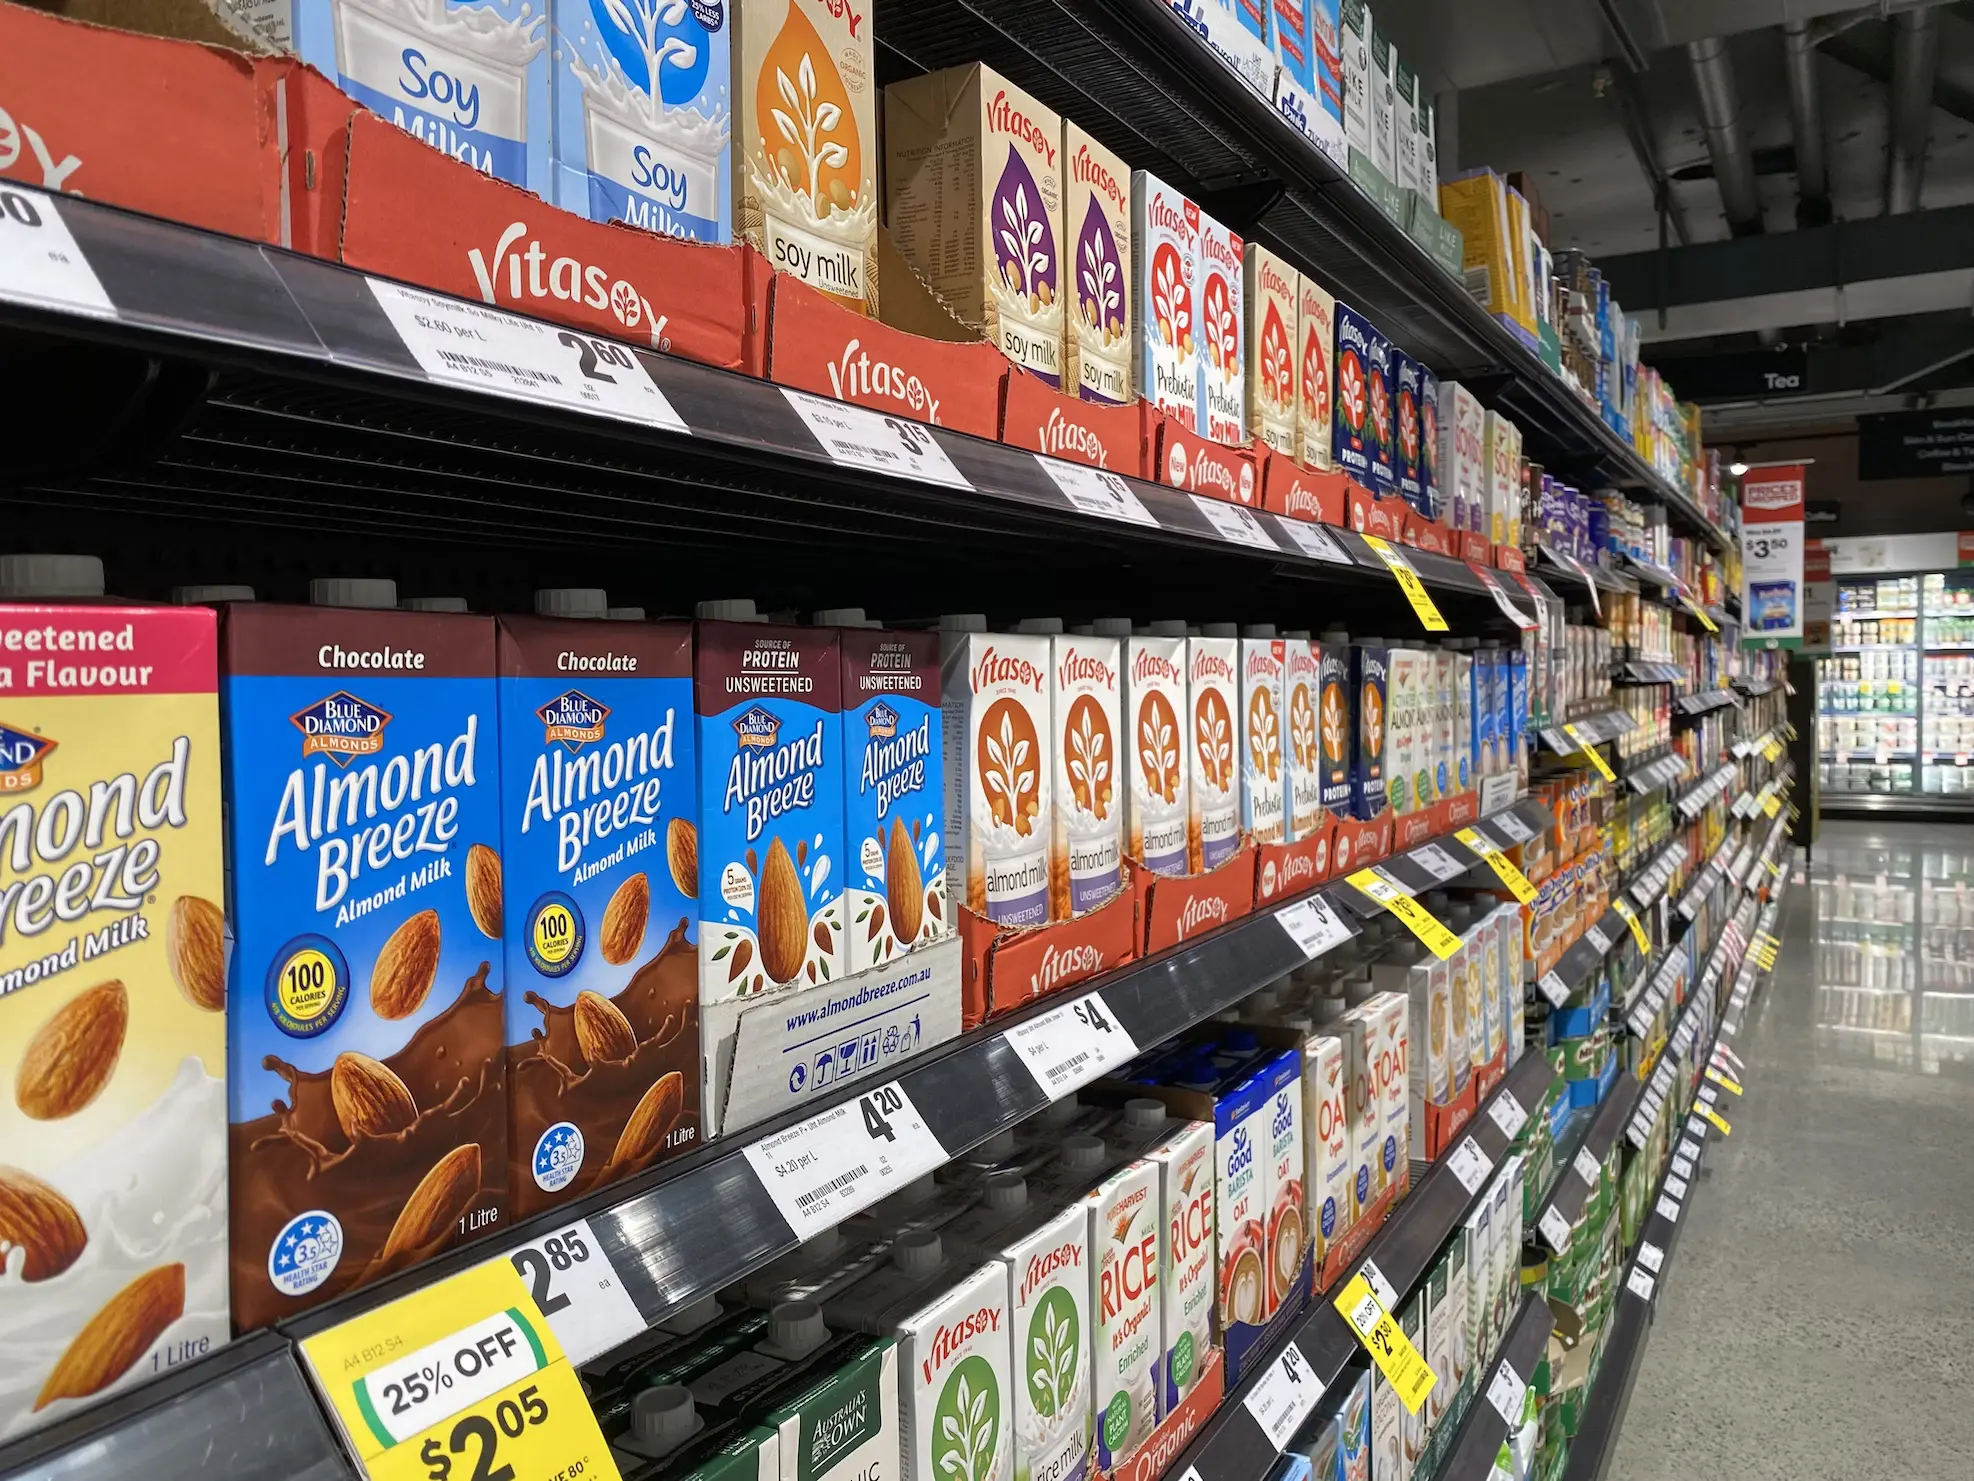
▪ As markdowns increase, shrink will often decrease. As markdowns decrease, shrink often increases.
▪ The two statistics are often not mutually exclusive, though many retail leaders treat them as if they are.
by Johnny Custer, CFI, LPC, LPQ – COO Freeing Returns
Posted on August 11, 2023 at 12:00 PM

In an environment where operational execution is strained or inconsistent, the following trends often hold true year over year:
▪ As markdowns increase, shrink will often decrease. As markdowns decrease, shrink often increases.
▪ The two statistics are often not mutually exclusive, though many retail leaders treat them as if they are.
While often expected and sometimes necessary to drive the business forward, markdowns still impact the bottom line, especially when considering the unbudgeted, store-initiated markdowns generated to mitigate aging or excessive inventory. When markdown activity grows year-over-year, the root cause of what is driving this markdown behavior must be addressed to stop this negative trend and break the repetitive cycle.
Failure to acknowledge the reality of the composite of these numbers could result in labeling a good store as a bad one or a bad store as a good one.
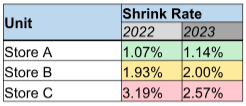
Please consider the chart below. Based on typical industry thought and focus, most companies would look at the statistics below and would consider Store C to be the store that requires the most focus. Because of its high shrink rate, it appears to be the store with the most opportunity for improvement.
The following typically happens to a store that is seen in this manner:
▪ The store is placed on a high-priority or target (naughty) store list.
▪ Shrinkage action plans are required for continuous follow-up until the store graduates from the naughty list.
▪ Field managers, including operations managers, internal auditors, or loss prevention personnel, are required to visit this location on a pre-determined basis (often weekly or monthly).
▪ Significant dollars are dedicated to anti-theft equipment at this location in the form of CCTV, EAS, as well as the additional payroll and personnel allotted.
▪ Product is locked up in glass cases or other restrictive devices, impacting sales and creating a negative customer experience.

The traditional way of looking at and attempting to minimize retail loss only considers a fraction of the story. The chart below has been changed to include additional data points related to profit and loss (P&L) performance.
By simply adding markdown rates for the same years in question, we can add both P&L line items and come up with a very different story about where our opportunity lies.
Consider the sum of these two figures under the header “Fully Loaded.” Store C—previously thought of as the problem child store—is now elevated into the middle of the pack, and its EBITDA performance supports this fact.
Store A, which would have produced hugs and high-fives because of the shrink results, would be largely ignored from a “target store” standpoint, and critical issues with the store’s operational execution would continue to stumble unchecked.

So, while all focus, attention, and spending go toward reducing the shrink in Store C, Store A continues to build inventory, and drive high markdowns, while significantly impacting EBIDTA.
While shrink continues to be a primary indicator of performance for many retailers, it’s important to consider the full picture for loss prevention professionals who are behaving as a true business partner.
Originally published by Loss Prevention Magazine.